Analysing Solr logs with Logstash
Analysing Solr logs with Logstash
Although I usually write about and work with Apache Solr, I also use the ELK stack on a daily basis on a number of projects. If you’re not familiar with Solr, take a look at some of my previous posts. If you need some more background info on the ELK stack, both Christoffer and André have written many great posts on various ELK subjects. The most common use for the stack is data analysis. In our case, Solr search log analysis.
As a little side note for the truly devoted Solr users, an ELK stack alternative exists with SiLK. I highly recommend checking out Lucidworks’ various blog posts on Solr and search in general.
Some background
On an existing search project I use the ELK stack to ingest, analysis and visualise logs from Comperio’s search middleware application.
Although this gave us a great view of user query behaviour, Solr logs a great more detailed information. I wanted to log indexing events, errors and the searches with all other parameters in addition to just the query string.
Lets get started
I’m going to assume you already have a running Solr installation. You will, however, need to download Elasticsearch and Logstash and unpack them. Before we start Elasticsearch, I recommend installing these plugins:
Head is a cluster health monitoring tool. Marvel we’ll only need for the bundled developer console, Sense. To disable Marvel’s other capabilities, add this line to ~/elasticsearch/config/elasticsearch.yml
|
1 |
marvel.agent.enabled: false |
Start elasticsearch with this command:
|
1 |
~/elasticsearch-[version]/bin/elasticsearch |
Navigate to http://localhost:9200/ to confirm that Elasticsearch is running. Check http://localhost:9200/_plugin/head and http://localhost:9200/_plugin/marvel/sense/index.html to verify the plugins installed correctly.
The anatomy of a Logstash config
Update 21/09/15
I have since greatly simplified the multiline portions of the Logstash configs. Use instead this filter section: The rest of the original article contents are unchanged for comparison’s sake.
All Logstash configs share three main building blocks. It starts with the Input stage, which defines what the data source is and how to access it. Next is the Filter stage, which carries out data processing and extraction. Finally, the Output stage tells Logstash where to send the processed data. Lets start with the basics, the input and output stages:
|
1 2 3 4 5 6 7 8 9 10 11 12 13 14 15 16 |
input { file { path => "~/solr.log" } } filter {} output { # Send directly to local Elasticsearch elasticsearch_http { host => "localhost" template => "~/logstash/bin/logstash_solr_template.json" index => "solr-%{+YYYY.MM.dd}" template_overwrite => true } |
This is one of the simpler input/output configs. We read a file at a given location and stream its raw contents to an Elasticsearch instance. Take a look at the input and output plugins’ documentation for more details and default values. The index setting causes Logstash to create a new index every day with a name generated from the provided pattern. The template option tells Logstash what kind of field mapping and settings to use when creating the Elasticsearch indices. You can find the template file I used here.
To process the Solr logs, we’ll use the grok, mutate, multiline, drop and kv filter plugins.
- Grok is a regexp based parsing stage primarily used to match strings and extract parts. There are a number of default patterns described on the grok documentation page. While building your grok expressions, the grok debugger app is particularly helpful. Be mindful though that some of the escaping syntax isn’t always the same in the app as what the Logstash config expects.
- We need the multiline plugin to link stacktraces to their initial error message.
- The kv, aka key value, plugin will help us extract the parameters from Solr indexing and search events
- We use mutate to add and remove tags along the way.
- And finally, drop to drop any events we don’t want to keep.
The hard fun part
Lets dive into the filter stage now. Take a look at the config file I’m using. The Grok patterns may appear a bit daunting, especially if you’re not very familiar with regexp and the default Grok patterns, but don’t worry! Lets break it down.
The first section extracts the log event’s severity and timestamp into their own fields, ‘level’ and ‘LogTime’:
|
1 2 3 4 |
grok { match => { "message" => "%{WORD:level}.+?- %{DATA:LogTime};" } tag_on_failure => [] } |
So, given this line from my example log file
|
1 |
INFO - 2015-09-07 15:40:34.535; org.apache.solr.update.processor.LogUpdateProcessor; [sintef_main] webapp=/ path=/update/extract params={literal.source=epifile&literal.epi_file_title=GOFER+L4.0+Demonstratorer+V1.0.pdf&literal.title=GOFER+L4.0+Demonstratorer+V1.0.pdf&literal.id=epifile_211278&literal.epifileid_s=211278&literal.url=http://www.sintef.no/globalassets/upload/teknologi_samfunn/6060/prosjektfiler/gofer/gofer-l4.0-demonstratorer-v1.0.pdf&stream.url=http://www.sintef.no/globalassets/upload/teknologi_samfunn/6060/prosjektfiler/gofer/gofer-l4.0-demonstratorer-v1.0.pdf&literal.filesource_s=SiteFile} {} 0 65 |
We’d extract
|
1 |
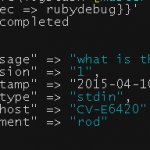
{ "level": "INFO", "LogTime":"2015-09-07 15:40:34.535"} |
In the template file I linked earlier, you’ll notice configuration for the LogTime field. Here we define for Elasticsearch a valid DateTime format. We need to do this so that Kibana recognises the field as one we can use for temporal analyses. Otherwise the only timestamp field we’d have would contain the time at which the logs were processed and stored in Elasticsearch. Although not a problem in a realtime log analyses system, if you have old logs you want to parse you will need to define this separate timestamp field. As an additional sidenote, you’ll notice I use
|
1 |
tag_on_failure => [] |
in most of my Grok stages. The default value is “_grokparsefailure”, which I don’t need in a production system. Custom failure and success tags are very helpful to debug your Logstash configs.
The next little section combines commit messages into a single line. The first event in the example log file is an example of such commit messages split over three lines.
|
1 2 3 4 5 |
# Combine commit events into single message multiline { pattern => "^\t(commit\{)" what => "previous" } |
Now we come to a major section for handling general INFO level messages.
|
1 2 3 4 5 6 7 8 9 10 11 12 13 14 15 16 17 18 19 20 21 22 23 24 25 26 27 28 |
# INFO level events treated differently than ERROR if "INFO" in [level] { grok { match => { "message" => ".+?; ((([a-zA-Z]+(\.|;|:))+) )+?\[%{WORD:collection}\].+?path=%{DATA:endpoint} params=\{%{DATA:params}\}.+?\{%{WORD:action}=\[%{DATA:docId}" } tag_on_failure => [] } if [params] { kv { field_split => "&" source => "params" } } else { grok { match => { "message" => ".+?; ((([a-zA-Z]+(\.|;|:))+) )+?commits" } tag_on_failure => [ "drop" ] add_field => { "action" => "commit" } } if "drop" in [tags] { drop {} } } } |
This filter will only run on INFO level messages, due to the conditional at its beginning. The first Grok stage matches log events similar to the one above. The key fields we extract are the Solr collection/core, the endpoint we hit e.g. update/extract, the parameters supplied by the HTTP request, what action e.g. add or delete and finally the document ID. If the Grok succeeded to extract a params field, we run the key value stage, splitting no ampersand to extract each HTTP parameter. This is how a resulting document’s extracted contents look like when stored in Elasticsearch:
|
1 2 3 4 5 6 7 8 9 10 11 12 13 14 15 16 17 18 |
{ "level": "INFO", "LogTime": "2015-09-07 15:40:18.938", "collection": "sintef_main", "endpoint": "/update/extract", "params": "literal.source=epifile&literal.epi_file_title=A05100_Tass5+Trondheim.pdf&literal.title=A05100_Tass5+Trondheim.pdf&literal.id=epifile_211027&literal.epifileid_s=211027&literal.url=http://www.sintef.no/globalassets/upload/teknologi_samfunn/5036/a05100_tass5-trondheim.pdf&stream.url=http://www.sintef.no/globalassets/upload/teknologi_samfunn/5036/a05100_tass5-trondheim.pdf&literal.filesource_s=SiteFile", "action": "add", "docId": "epifile_211027", "version": "1511661994131849216", "literal.source": "epifile", "literal.epi_file_title": "A05100_Tass5+Trondheim.pdf", "literal.title": "A05100_Tass5+Trondheim.pdf", "literal.id": "epifile_211027", "literal.epifileid_s": "211027", "literal.url": "http://www.sintef.no/globalassets/upload/teknologi_samfunn/5036/a05100_tass5-trondheim.pdf", "stream.url": "http://www.sintef.no/globalassets/upload/teknologi_samfunn/5036/a05100_tass5-trondheim.pdf", "literal.filesource_s": "SiteFile" } |
If the Grok did not extract a params field, I want to identify possible commit messages with the following Grok. If this one fails we tag messages with “drop”. Finally, any messages tagged with “drop” are dropped for the pipeline. I specifically created these Grok patterns to match indexing and commit messages as I already track queries at the middleware layer in our stack. If you want to track queries at the Solr level, simply use this pattern:
|
1 |
.+?; ((([a-zA-Z]+(\.|;|:))+) )+?\[%{WORD:collection}\].+?path=%{DATA:endpoint} params=\{%{DATA:params}\} hits=%{INT:hits} status=%{INT:status} QTime=%{INT:queryTime} |
The next section handles ERROR level messages:
|
1 2 3 4 5 6 7 8 9 10 11 12 13 14 15 16 17 18 19 20 21 |
# Error event implies stack track, which requires multiline parsing if "ERROR" in [level] { multiline { pattern => "^\s" what => "previous" add_tag => [ "multiline_pre" ] } multiline { pattern => "^Caused by" what => "previous" add_tag => [ "multiline_post" ] } if "multiline_post" in [tags] { grok { match => { "message" => ".+?; ((([a-zA-Z]+(\.|;|:))+) )+%{DATA:reason}(\n\t)((.+?Caused by: ((([a-zA-Z]+(\.|;|:))+) )+)%{DATA:reason}(\n\t))+" } tag_on_failure => [] } } } |
Given a stack trace, there’s a few in the example log file, this stage first combines all the lines of the stack trace into a single message. It then extracts the first and the last causes. The assumption being the first message is the high level failure message and the last one the actual underlying cause.
Finally, I drop any empty lines and clean up temporary tags:
|
1 2 3 4 5 6 7 8 |
# Remove intermediate tags, and multiline added randomly by multiline stage mutate { remove_tag => [ "multiline_pre", "multiline_post", "multiline" ] } # Drop empty lines if [message] =~ /^\s*$/ { drop {} } |
To check you have succesfully processed your Solr logs, open up the Sense plugin and run this query:
|
1 2 3 4 5 6 7 8 9 10 11 12 13 14 15 16 |
# aggregate on level GET solr-*/_search { "query": { "match_all": {} }, "size": 10, "aggs": { "action": { "terms": { "field": "level", "size": 10 } } } } |
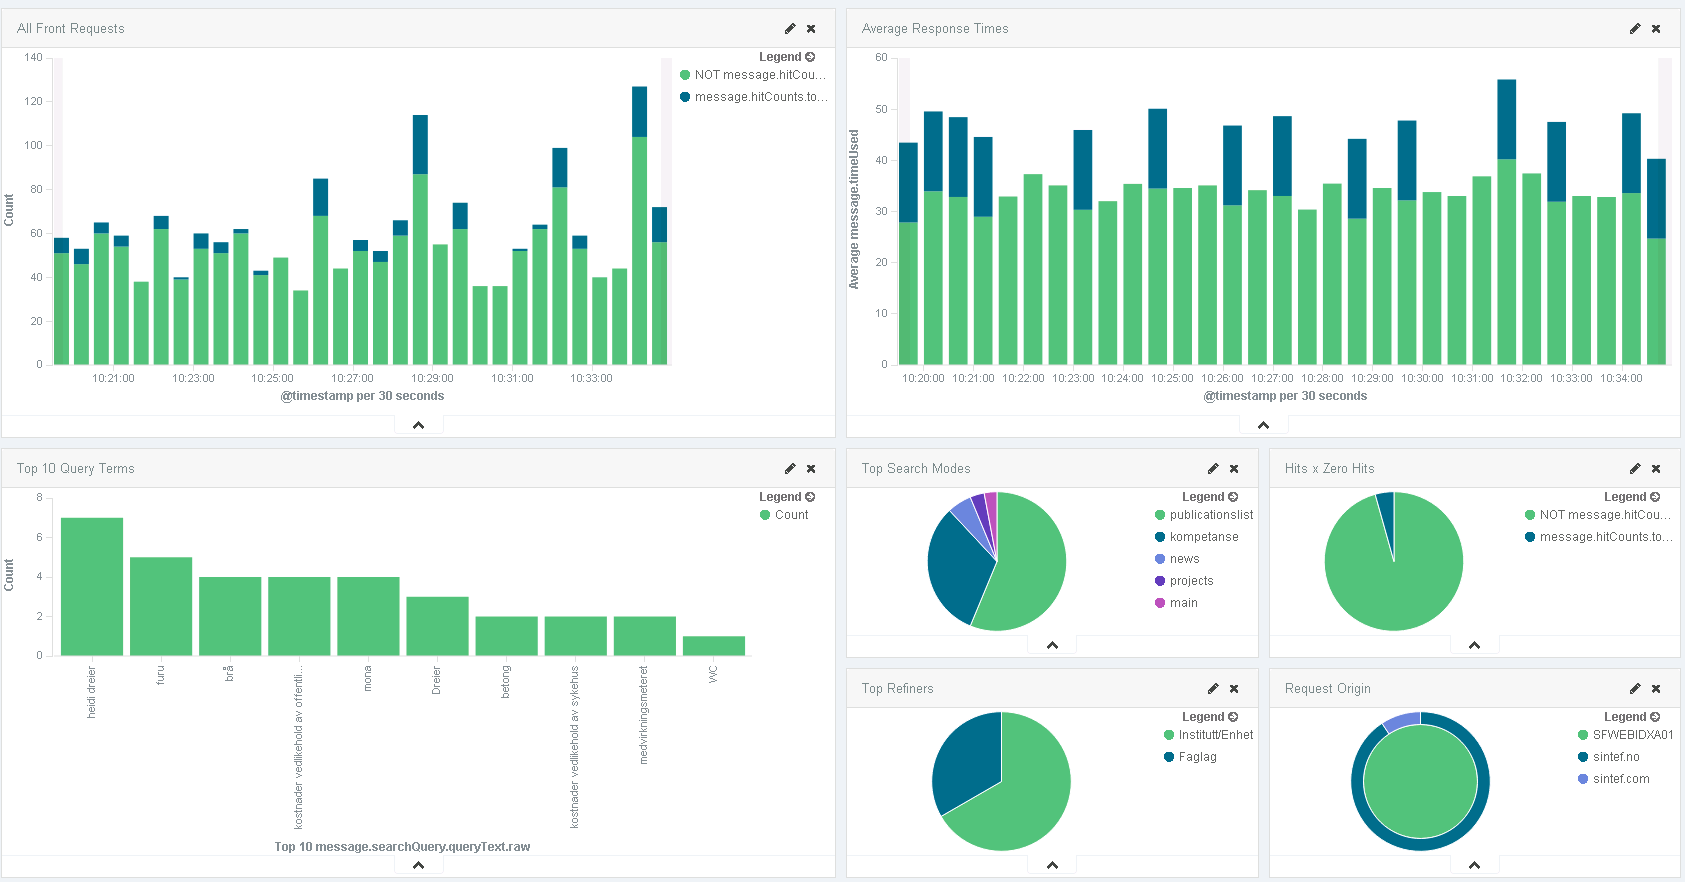
You should get back all your processed log events along with an aggregation on event severity.
Conclusion
Solr logs contain a great deal of useful information. With the ELK stack you can extract, store, analyse and visualise this data. I hope I’ve given you some helpful tips on how to start doing so! If you run into any problems, please get in touch in the comments below.