How to enable WCF tracing in FSIS
When developing client applications using WCF, you’re bound to sooner or later encounter the dreaded “The server was unable to process the request due to an internal error”. This means that the web service threw an unhandled exception, and if you don’t have access to the service itself, you’re simply just out of luck.
But many handled exceptions can be equally frustrating. I recently wrote a small demo application, showing a client how to integrate against FSIS from within their particular server environment. Everything looked okay (doesn’t it always :)), but whenever I ran my queries, FSIS just replied with “Socket Connection was aborted”.
A good place to start when debugging WCF problems is to enable tracing. I added the following XML snippet to my app.config, and opened the generated file with Microsoft Service Trace Viewer. Unfortunately for me, there were no additional error messages or hints on what the problem might be.
|
1 2 3 4 5 6 7 8 9 10 11 12 13 |
<system.diagnostics> <sources> <source name="System.ServiceModel" switchValue="Information, ActivityTracing" propagateActivity="true"> <listeners> <add name="traceListener" type="System.Diagnostics.XmlWriterTraceListener" initializeData="C:\Client-WcfTrace.svclog" /> </listeners> </source> </sources> </system.diagnostics> |
Digging further, I enabled tracing in the FSIS endpoint as well. The application configuration for the IMS node is by default sitting in the FSIS user’s home directory, more precisely:
C:\Users\[FSIS service user]\AppData\Local\FSIS\Nodes\Fsis\InteractionEngineNode1\Node.config
Under the System.Diagnostics XML node I added a source tag for System.ServiceModel, so that the whole segment looked like:
|
1 2 3 4 5 6 7 8 9 10 11 12 13 14 15 16 17 18 19 20 21 22 23 |
<system.diagnostics> <switches> <add name="NodeRunner" value="Info" /> <add name="Bootstrap" value="Info" /> <add name="Debug" value="0" /> </switches> <trace autoflush="false" indentsize="4"> <listeners> <remove name="Default" /> </listeners> </trace> <sources> <source name="System.ServiceModel" switchValue="Information, ActivityTracing" propagateActivity="true"> <listeners> <add name="wcfTraceListener" type="System.Diagnostics.XmlWriterTraceListener" initializeData="C:\Server-WcfTrace.svclog" /> </listeners> </source> </sources> </system.diagnostics> |
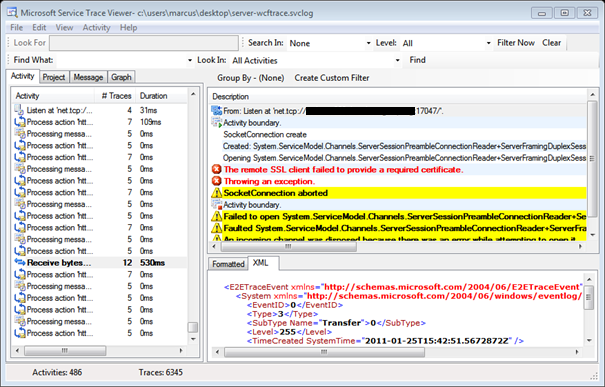
Sure enough! When inspecting the resulting log file in Trace Viewer, I found a red line indicating exactly what the problem was. In my case, I had messed up my certificates: “the remote SSL client failed to provide a required certificate”.
Read more about WCF tracing on MSDN, and if you haven’t already, make sure to also read my brief introduction to FAST Search for Internet Sites.


