Analyzing web server logs with Elasticsearch in the cloud
Using Logstash and Kibana on Found by Elastic, Part 1
This is part one of a two post blog series, aiming to demonstrate how to feed logs from IIS into Elasticsearch and Kibana via Logstash, using the hosted services provided by Found by Elastic. This post will deal with setting up the basic functionality and securing connections. Part 2 will show how to configure Logstash to read from IIS log files, and how to use Kibana 4 to visualize web traffic. Originally published on the Elastic Blog
Getting the Bits
For this demo I will be running Logstash and Kibana from my Windows laptop.
If you want to follow along, download and extract Logstash 1.5.RC4 or later, and Kibana 4.0.2 or later from https://www.elastic.co/downloads.
Creating an Elasticsearch Cluster
Creating a new trial cluster in Found is just a matter of logging in and pressing a button. It takes a few seconds until the cluster is ready, and a screen with some basic information on how to connect pops up. We need the address for the HTTPS endpoint, so copy that out.
Configuring Logstash
Now, with the brand new SSL connection option in Logstash, connecting to Found is as simple as this Logstash configuration
|
1 2 3 4 5 6 7 8 9 10 11 12 |
input { stdin{} } output { elasticsearch { protocol => http host => REPLACE_WITH_FOUND_CLUSTER_HOSTNAME port => "9243" # Check the port also ssl => true } stdout { codec => rubydebug } } |
Save the file as found.conf
Start up Logstash using
|
1 |
bin\logstash.bat agent --verbose -f found.conf |
You should see a message similar to
|
1 |
Create client to elasticsearch server on `https://....foundcluster.com:9243`: {:level=>:info} |
Once you see “Logstash startup completed” type in your favorite test term on the terminal. Mine is “fisk” so I type that.
You should see output on your screen showing what Logstash intends to pass on to elasticsearch.
We want to make sure this actually hits the cloud, so open a browser window and paste the HTTPS link from before, append /_search to the URL and hit enter.
You should now see the search results from your newly created Elasticsearch cluster, containing the favorite term you just typed in. We have a functioning connection from Logstash on our machine to Elasticsearch in the cloud! Congratulations!
Configuring Kibana 4
Kibana 4 comes with a built-in webserver. The configuration is done in a kibana.yml file in the config directory. Connecting to Elasticsearch in the cloud comes down to inserting the address of the Elasticsearch instance.
|
1 2 |
# The Elasticsearch instance to use for all your queries. elasticsearch_url: `https://....foundcluster.com:9243` |
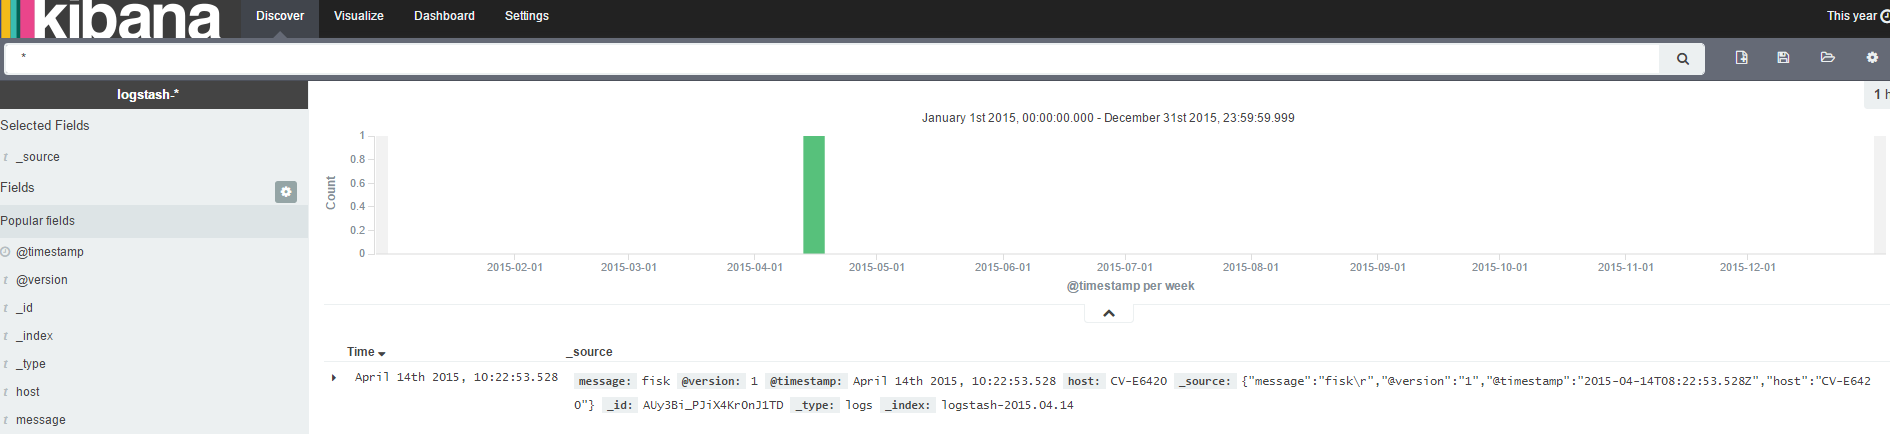
Of course, we need to verify that this really works, so we open up Kibana on http://localhost:5601, select the Logstash index template, with the @timestamp data field as suggested, and open up the discover panel. Now, if there was less than 15 minutes since you inserted your favorite test term in Logstash (previous step), you should see it already. Otherwise, change the date range by clicking on the selector in the top right corner.
Locking it down
Found by Elastic has worked hard to make the previous steps easy. We created an Elasticsearch cluster, fed data into it and displayed in Kibana in less than 5 minutes. We must have forgotten something!? And yes, of course! Something about security. We made sure to use secure connections with SSL, and the address generated for our cluster contains a 32 character long, randomly generated list of characters, which is pretty hard to guess. Should, however, the address slip out of our hands, hackers could easily delete our entire cluster. And we don’t want that to happen. So let’s see how we can make everything work when we add some basic security measures.
Access Control Lists
Found by Elastic has support for access control lists, where you can set up lists of usernames and passwords, with lists of rules that deny/allow access to various paths within Elasticsearch. This makes it easy to create a “read only” user, for instance, by creating a user with a rule that only allows access to the /_search path. Found by Elastic has a sample configuration with users searchonly and readwrite. We will use these as starting point but first we need to figure out what Kibana needs.
Kibana 4 Security
Kibana 4 stores its configuration in a special index, by default named “.kibana”. The Kibana webserver needs write access to this index. In addition, all Kibana users need write access to this index, for storing dashboards, visualizations and searches, and read access to all the indices that it will query. More details about the access demands of Kibana 4 can be found on the elastic blog.
For this demo, we will simply copy the “readwrite” user from the sample twice, naming one kibanaserver, the other kibanauser.
|
1 2 3 4 5 6 7 8 9 10 11 12 |
Setting Access Control in Found: # Allow everything for the readwrite-user, kibanauser and kibanaserver - paths: ['.*'] conditions: - basic_auth: users: - readwrite - kibanauser - kibanaserver - ssl: require: true action: allow |
Press save and the changes are immediately effective. Try to reload the Kibana at http://localhost:5601, you should be denied access.
Open up the kibana.yml file from before and modify it:
|
1 2 3 4 5 6 |
# If your Elasticsearch is protected with basic auth, this is the user credentials # used by the Kibana server to perform maintence on the kibana_index at statup. Your Kibana # users will still need to authenticate with Elasticsearch (which is proxied thorugh # the Kibana server) kibana_elasticsearch_username: kibanaserver kibana_elasticsearch_password: `KIBANASERVER_USER_PASSWORD` |
Stop and start Kibana to effectuate settings.
Now when Kibana starts up, you will be presented with a login box for HTTP authentication.
Type in kibanauser as the username, and the password . You should now again be presented with the Discover screen, showing the previously entered favorite test term. Again, you may have to expand the time range to see your entry.
Logstash Security
Logstash will also need to supply credentials when connecting to Found by Elastic. We reuse permission from the readwrite user once again, this time giving the name “logstash”.
It is simply a matter of supplying the username and password in the configuration file.
|
1 2 3 4 5 6 7 |
output { elasticsearch { …. user => “logstash”, password => `LOGSTASH_USER_PASSWORD` } } |
Wrapping it up
This has been a short dive into Logstash and Kibana with Found by Elastic. The recent changes done in order to support the Shield plugin for Elasticsearch, Logstash and Kibana, make it very easy to use the secure features of Found by Elastic. In the next post we will look into feeding logs from IIS into Elasticsearch via Logstash, and visualizing the most used query terms in Kibana.