Query log analysis – using logstash, elasticsearch and kibana
As a search consultant I need to understand how a search application is used with the end goal of providing a better search experience for the end user. That story can come from many places and part of that story can be found in the query logs.
Analyzing query logs brings insight into how a search application is used, use that insight to improve the next version of the search application.
What is a query log?
A query log consists of information about a query against a search application or search engine. They often contain information about when the query was executed, the query text, the context, applied facets, pagination, hit counts and so on.
The source data is a mess

JSON query log
The problem however is these logs are often plain text files located on multiple servers and are created by the search engine, not the search application that “knows” the user or at least the context. To solve these two issues I added logging to the search application and wrote each line in the log file as JSON. This gave me a couple of improvements, I now have 1 entry in the log file per user query (no matter if the application executes parallel queries against the search engine) and the content is now structured.
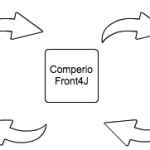
](http://blog.comperiosearch.com/wp-content/uploads/2013/12/querylog_analysis_03.png)
Get the query log from the search application, Graphics: Espen Klem
Logstash, ElasticSearch and Kibana to the rescue
These log files are still hard to use on their own. They are made by a computer for a computer and I am human trying to understand other humans. Logstash, ElasticSearch and Kibana to the rescue! Logstash is a tool for managing events and logs. You can use it to collect logs, parse them, and store them for later use (statement humbly borrowed from http://logstash.net). ElasticSearch is a distributed restful search and analytics engine (yet again borrowed, but from http://www.elasticsearch.org/overview/). Kibana is a GUI tool to visualize logs and time-stamped data in realtime (yet again borrowed, but from http://www.elasticsearch.org/overview/kibana/). These three tools make up a pretty good toolkit for creating some graphs and dashboards.
Logstash
Since I have already structured my log files in the search application Logstash does not have to do that for me, but there are other features of Logstash that are quite useful for dealing with event data. First of it can read my log files and send the data off to a central queue solving the issue of my log files living on multiple servers. After that another instance of Logstash picks up each event from the queue and forwards it to ElasticSearch and creating one new index per day. Since Logstash is a powerful content processing framework, should I need to do some kind of pre-processing of my data before indexing I have somewhere to do it.
ElasticSearch & Kibana
As mentioned Logstash puts the events into one ElasticSearch index per day. Kibana retrieves relevant data from ElasticSearch using a set of configured queries and facets. Since ElasticSearch by default tokenizes all string properties in an indexed document I had to disable that for the query text property, but I wanted make sure that the content was lowercased so that the casing of the users input did not matter (since that was the case for the search application too). Here is a snippet of the how this configuration could look in an index template.
The end result
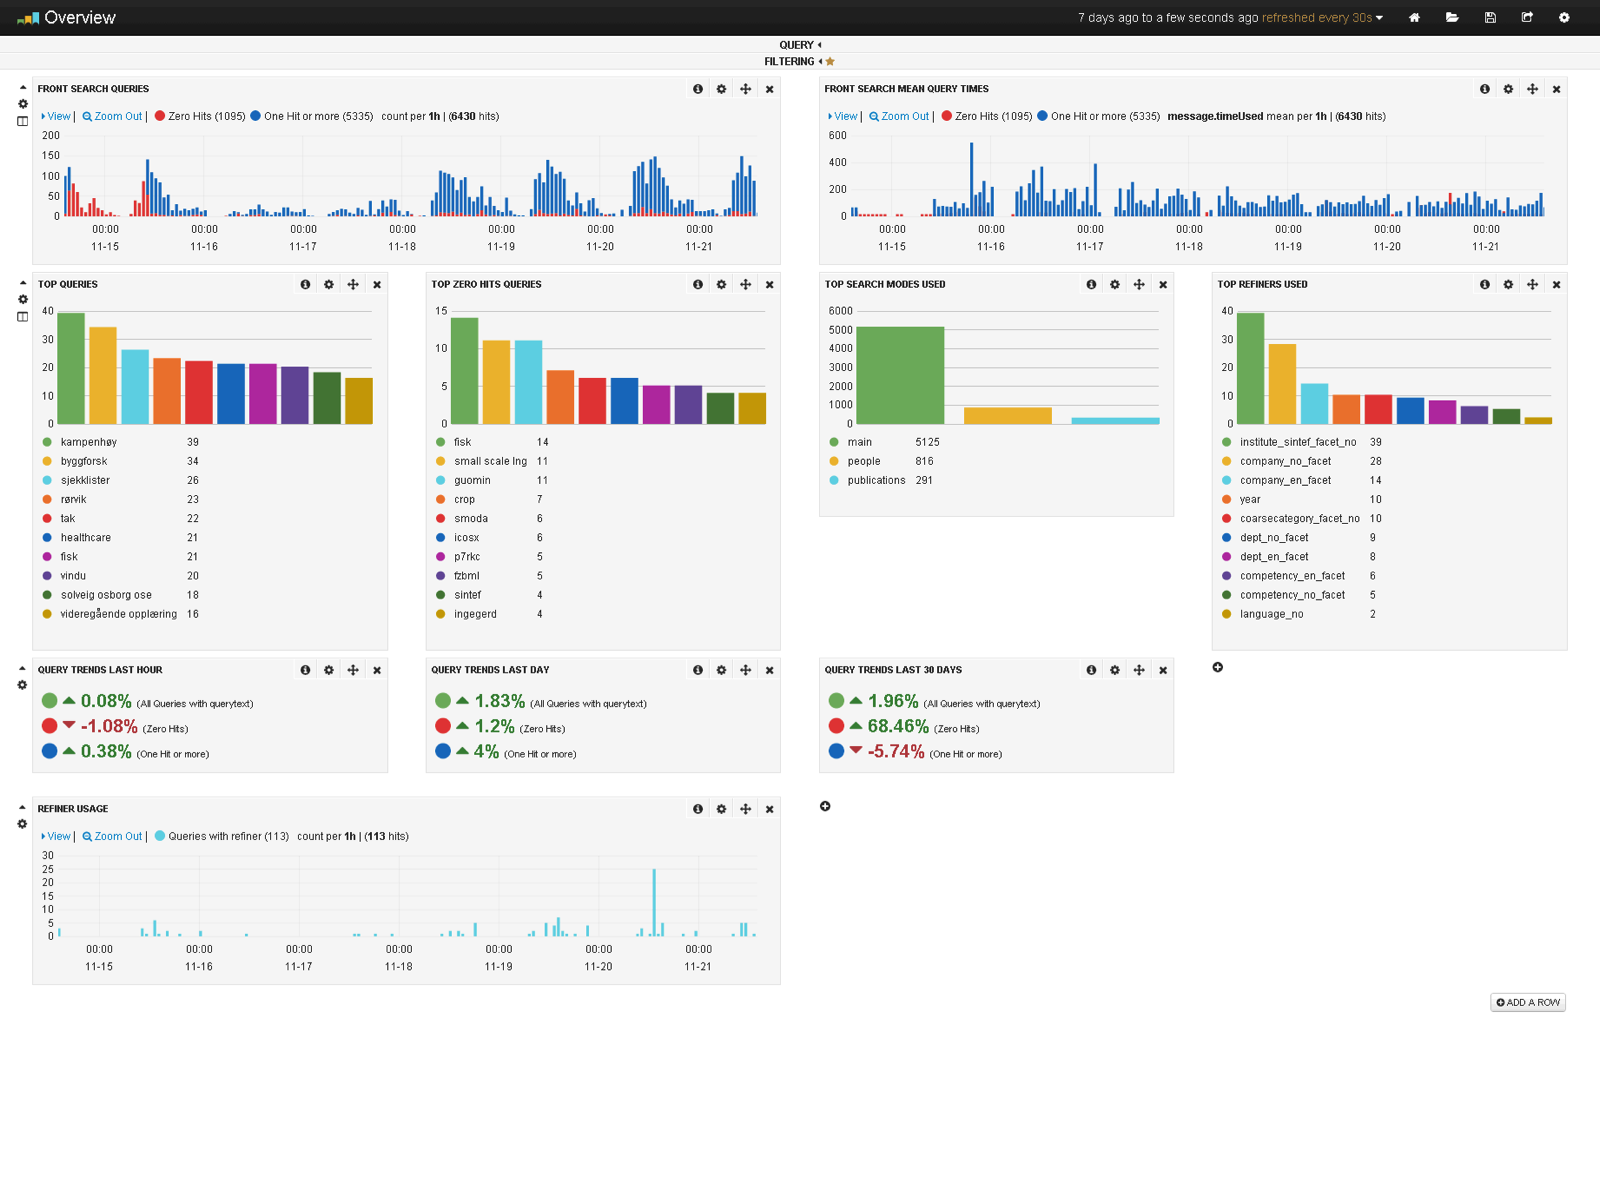
Quick overview over search application usage
The overview dashboard gives a quick overview over what the users are searching for and what facets they are using. There is also a graph for displaying the query load on the application and one for the average query load. The last histogram contains information for facet use over time. Clicking on the bars in the “Top Search Modes” graph allows for focusing all the graphs on a single search mode from the application.
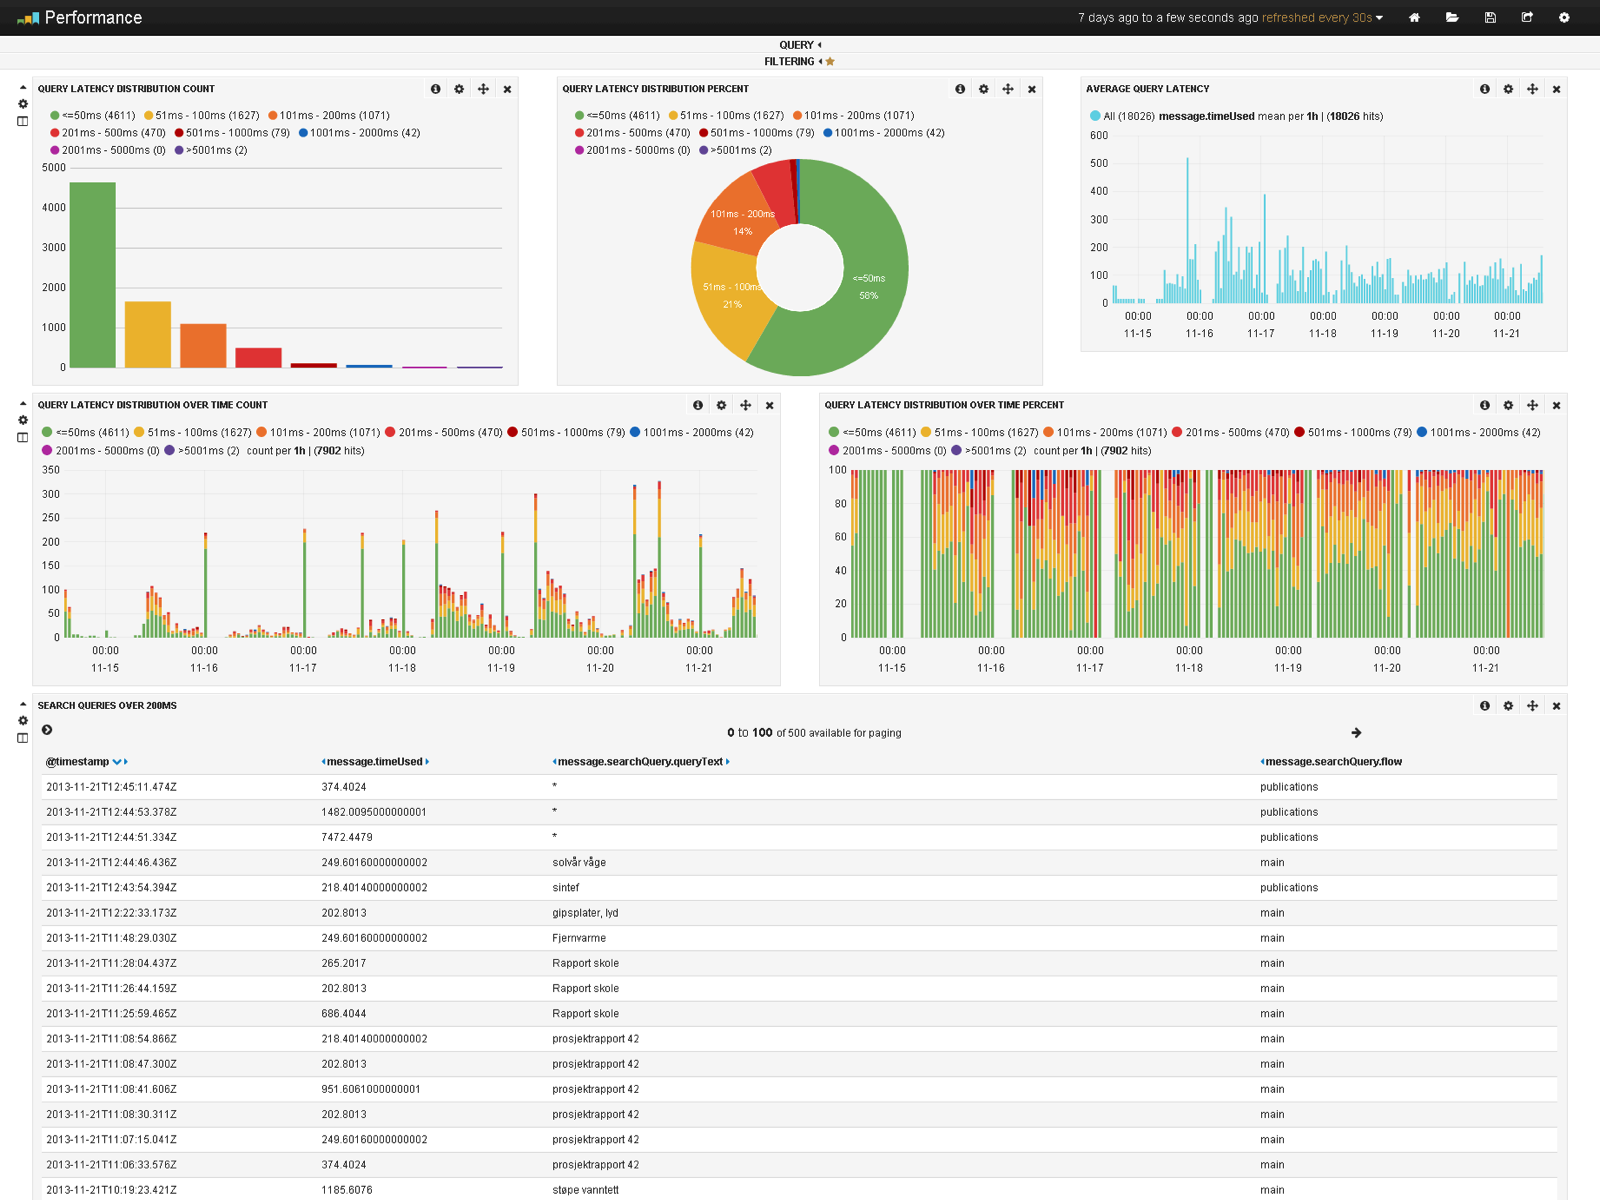
Search application performance information
Performance information is provided by the second dashboard. The main goal of this board is to answer the question “are the users getting their results back quickly”, in technical terms “is search latency low (good) or high (bad)”. The query log is broken into blocks of interesting ranges of latency giving a quick overview if most of the queries are “in the green” meaning that they are executed in under 50ms (defined as good performance in this case).
What is missing?
This is all a good start, but there are pieces to the puzzle I am missing. I would like to collect information about the hits users are choosing and link that to the queries they are executing, this would allow for “calculation”/analysis of how relevant the search result presented by the application are. Next it would be nice to have information about a user session to provide an understanding about the users query chain (he/she first queried for term1, clicked on hit no. 3, the queried for term2 and clicked hit no. 1. I looked into using Google Analytics, Piwik or some other non-custom tool, but I chose this because I felt need for something that I could customize fully and was extensible to deal with any kind of log files. It did not hurt either that all the technologies used are OpenSource.
References
- http://www.elasticsearch.org
- http://logstash.net
- various post on http://stackoverflow.com
Big thanks to all the people on the #elasticsearch and #logstash IRC channels on freenode that helped me figuring out the quirks.