Kibana 4 – the beer analytics engine
Kibana 4 is a great tool for analyzing data. Vinmonopolet, the Norwegian government owned alcoholic beverage retail monopoly, makes their list of products available online in an easily digestible csv format. So, what beer should I buy next? Kibana will soon tell me.
Kibana 4 is a data visualization and analytics tool for elasticsearch. Kibana 4 was launched in February 2015, and builds on top of Kibana 3, incorporating user feedback and recent developments in elasticsearch, the most mind blowing being the support for aggregations. Aggregations are like facets/navigators/refiners on steroids, with a lot of advanced options for data drill-down. But no matter how easy a tool is to use, it only gets interesting once we have some questions that need to be answered. So what I want to know is:
1. What beer gives the most value for money?
2. What is the most Belgian of Belgian beers?
3. Which of the most Belgian beers give the most value for money?
The dataset from Vinmonopolet does not contain the important metric “price pr unit of alcohol”. So to begin with, we need to add that. It could have been done in Excel, or as part of preprocessing. Since this post isn’t about how to get data data indexed in elasticsearch we use a nice new feature of Kibana that lets you add calculated fields.
In the Settings -> Indices section, there is an an option to create a Scripted Field.
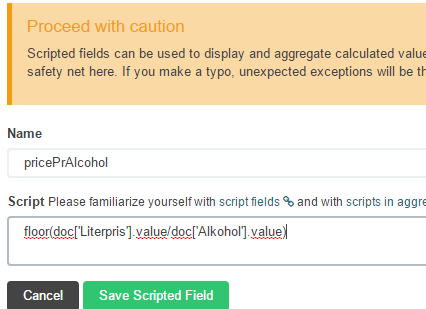
The field for price pr.unit of alcohol is added as calculation in the scripted field, flooring the number to the nearest integer. Scripting is done using Lucene Expressions, after some vulnerabilites were discovered with using Groovy as scripting language (this changed from RC to the final release of Kibana).
What beer gives the most value for money?
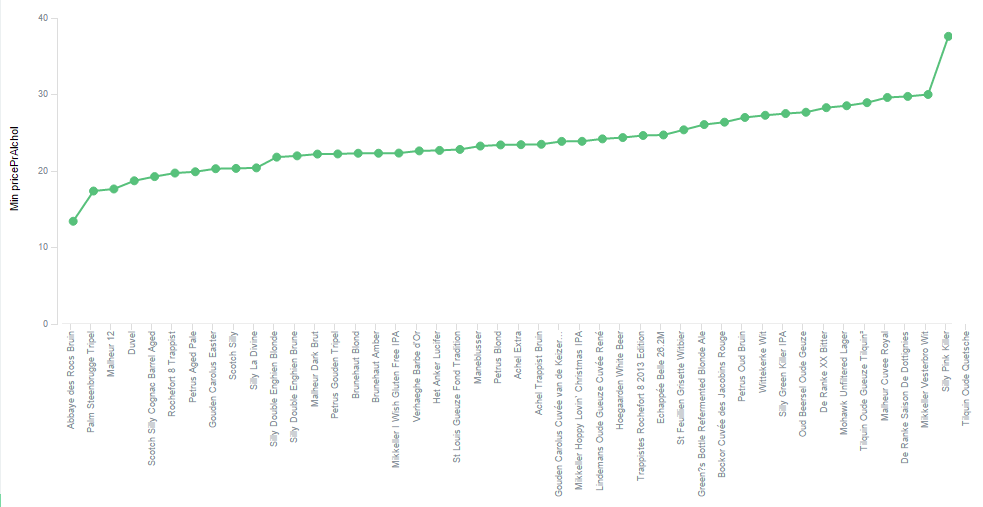
Now we can create a nice little bar chart in Kibana. Using the minimum pricePrAlcohol as Y-axis, bottom terms Varenavn as X-axis.
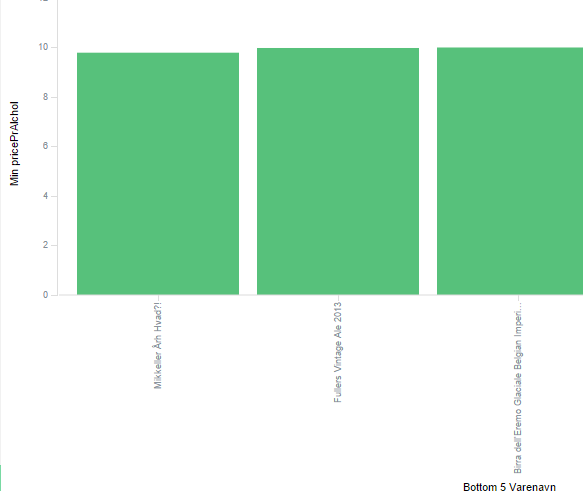
The chart reveals that beer with the best alcohol/price ratio is Mikkeler Årh Hvad?!, A very nice beer, I had it last week. Mikkeler is a Danish brewery, but they brew most of their beer in Belgium, so this is actually a Belgian beer.
What is the most Belgian of Belgian beers?
Next up I want to figure out what is the most Belgian of Belgian beers. Most of the products in Vinmonopolet’s catalogue have entries for “Smak”, or “Taste”. Let’s put the significant terms aggregation to work on “Smak” and see what falls out.
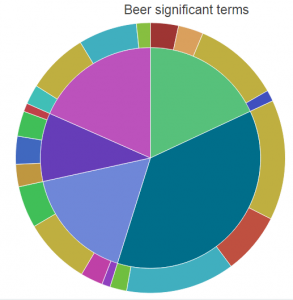
The pie chart shows countries in the inner circle, and significant terms in the outer circle. The largest pie belongs to Norwegian beers, as shown in the legend on the right. Using Kibana, you can also hover over the entries to highlight the selection in the pie chart, very nice feature especially for the colourly challenged population that are unable to match colors. Kibana allows drill down by clicking on pie slices, and you can see the data table and other details by clicking on the small arrow at the bottom.
The most significant terms for Belgian beers according to this query is “bread”, “yeast”, “malt” and “malty”. That’s hardly surprising since this is beer. We should expect something a little more specific. The significant terms aggregation returns terms that are more frequent in a foreground selection, compared to a background selection. In our case, we select product of type beer, from country Belgium, and the background is by default the contents of the entire index, or in other words, the complete product catalog from Vinmonopolet. This catalog contains a vast amount of wine, liquor and other irrelevant items. Since we are really only interested to see the significant terms of Belgian beers compared to other beers, we can add a custom parameter to select the background manually. Paste this into the JSON input of the advanced section.
|
1 2 3 4 5 6 7 |
{ "background_filter": { "term": { "Varetype": "Øl" } } } |
Using this filter, the significant terms for Belgian beers are “impact, plum, lemon, bread”.
What beers actually match these descriptions? Some suggestions can be revealed through nesting an aggregation on product name, on top of the one we already have.
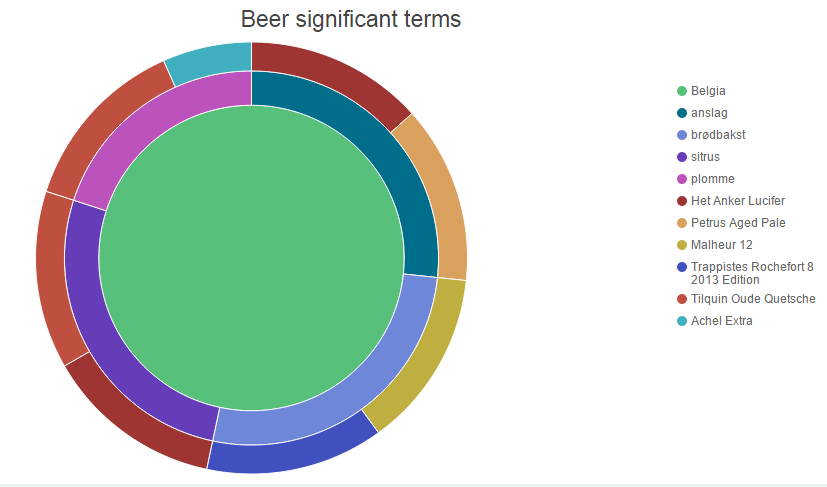
The non-colourly-challenged may easily see that Het Anker Lucifer matches both “anslag” (impact) and “sitrus” (lemon). Some beers match two terms, others match one, none match all four terms. Ideally, the most Belgian of Belgian beers should contain all the most significant terms. The significant terms are “impact,bread,lemon,plum” (“anslag,brødbakst,sitrus,plomme”). Typing this as a Lucene query into the Discover tab on Kibana.
|
1 |
Land:Belgia AND Smak:sitrus,plomme,brødbakst,anslag AND Varetype:Øl |
Returns “Silly Green Killer IPA” at result number 1, having Smak: “Fruktig anslag med sitrus, korn, humle og brødbakst. Lang, frisk avslutning.” Containing three of the terms; impact, lemon and bread. Since no beers contain all four terms, we can hereby pronounce a winner of most Belgian of all Belgian beers according to Vinomonpolet catalogoue (and a ridiculous significant terms trick): Silly Green Killer IPA! Congratulations!
Which of the most Belgian beers give the most value for money?
The previous investigation did not take economic considerations into account. Using the Line Chart, reusing the saved search from the previous query, adding the minimum pricePrAlcohol as Y-axis, and setting the X-axis to the terms aggregation for Varenavn (product name) bumping it up to 52 entries to make sure it contains all the results. The graph shows all beers containing at least one of our sought after terms. The Silly Green Killer IPA can be found at the upper quart of the table having a price pr alcohol unit at 27.51. Abbaye de Rocs Bruin comes in as a winner at the bottom edge of the scale, with a whooping 13.43 NOK pr alcohol unit, having a Smak field containing only the term “sitrus” (lemon).
It would be nice to see what terms the beers contain, to enable a qualified judgement. Kibana allows to split up the display into several graphs. I will use this together with the filter aggregation to show one graph for each of the significant terms.
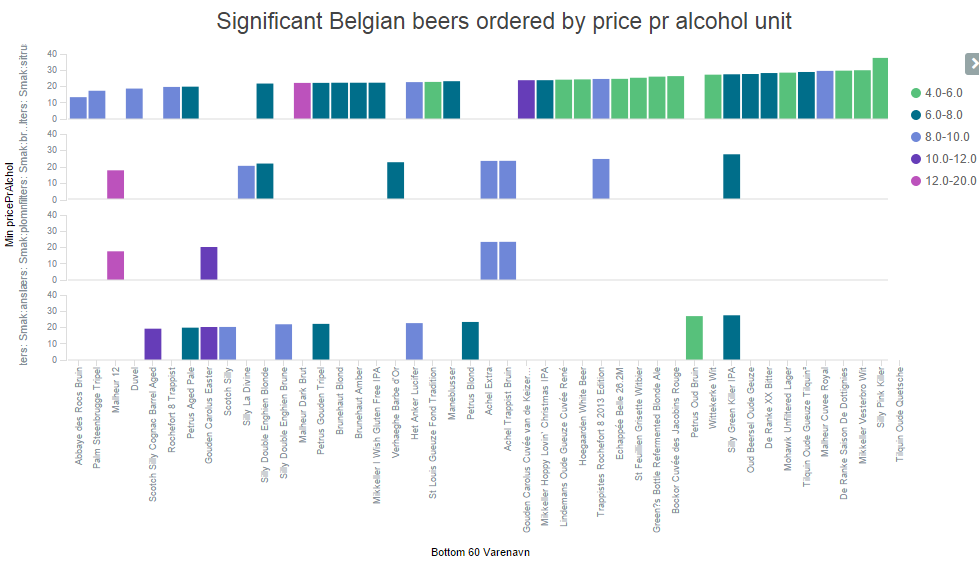
The graphs are, from top to bottom: sitrus (lemon), brødbakst (bread), anslag (impact), plomme (plum). The colors indicate alcohol content.
In this post, I have tried to show how you can use Kibana 4 and elasticsearch for data exploration and analysis. Please use the comment form below or contact me if you have any questions. If you enjoyed this article, why don’t you give me a toast on Untapped!


Neat post…but how did you get a CSV file indexed into ElasticSeach ? I assume you somehow converted it to JSON then imported it.
Curious what your preferred was is for doing that…
Good question! Source code will be published shortly. Keywords: python, vagrant
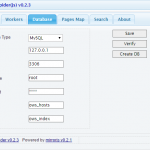
Code to setup a vagrant ELK box containing the vinmonopolet catalogoue and Kibana 4 is now availble on github
To clone just this branch, use:
Can we have a post on export URL parameters for Kibana 4 visualizations?
Hi Anish,
I’m not quite sure what you mean, but if you’re after documentation for the URL parameters for dashboards, you might have to Iook it up in the source code.
Nice post, thanks. Can Kibana plot scripted aggregates? I would like to plot an ecommerce conversion rate.
count of documents where converted=true / count of documents
Thanks!
Hi Geoff,
Yes you could do that.
Depending on your exact datastructure, you might have to add a field converted with value false to get the counts right. Often the best strategy is to make sure the data you send in to elasticsearch contains all the detail you need -> preprocess it somehow.
Great! Any tips on how to get started or a pointer to a relevant tutorial?
I’ve been using Kibana 3 where it is very easy to plot a count of “converted=true” in a histogram, as well as a histogram of a count of all documents (visits in this case) over time. But I don’t know how to plot the conversion rate I mentioned. I have a converted:true field when the visit results in a sale but the field does not appear at all when converted is false.
Hi,
Thanks a lot for the post. Very useful as I just start with Kibana.
I’m interested in the same issue as Geoff about plotting scripted aggregates. If you have tips on how to do that it would be great.