SharePoint ULS log analysis using ELK
E is for Elasticsearch
Elasticsearch is an open source search and analytics engine that extends the limits of full-text search through a robust set of APIs and DSLs, to deliver a flexible and almost limitless search experience.
L is for Logstash
One of the most popular open source log parser solutions on the market, Logstash has the possibility of reading any data source and extracting the data in JSON format, easy to use and running in minutes.
K is for Kibana
A data visualization engine, Kibana allows the user to create custom dashboards and to analyze Elasticsearch data on-the-fly and in real-time.
Getting set up
To start using this technology, you just need to install the three above mentioned components, which actually means downloading and unzipping three archive files.
The data flow is this: the log files are text files residing in a folder. Logstash will use a configuration file to read from the logs and parse all the entries. The parsed data will be sent to Elasticsearch for storing. Once here, it can be easily read and displayed by Kibana.

Parsing SharePoint ULS log files with Logstash
We will now focus on the most simple and straightforward way of getting this to work, without any additional configuration or settings. Our goal is to open Kibana and be able to configure some charts that will help us visualize and explore what type of entries we have in the SharePoint ULS logs, and to be able to search the logs for interesting entries.
To begin, we need some ULS log files from SharePoint that will be placed in a folder on the server (I am working on a Windows Server virtual environment) where we are testing the ELK stack. My ULS logs are located here: C:\Program Files\Common Files\Microsoft Shared\Web Server Extensions\14\LOGS
As an example, the first line in one of my log files looks like this:
|
1 |
05/06/2014 10:20:20.85 wsstracing.exe (0x0900) 0x0928SharePoint Foundation Tracing Controller Service 5152InformationTracing Service started. |
The next step is to build the configuration file. This is a text file with a .config extension, located by default in the Logstash folder. The starting point for the content of this file would be:
|
1 2 3 4 5 6 7 8 9 10 11 12 13 14 15 16 17 |
input { file { type => "sharepointlog" path => ["[folder where the logs reside]/*.log"] start_position => "beginning" codec => "plain" } } filter { } output { elasticsearch { embedded => true } } |
The Input defines the location of the logs and some reading parameters, like the starting position where Logstash will begin parsing the files. The Output section defines the location of the parsed data, in our case the Elasticsearch instance installed on the same server.
Now for the important part, the Filter section. The Filter section contains one or more GROK patterns that are used by Logstash for identifying the format of the log entries. There are many types of entries, but we are focusing on the event type and message, so we have to parse all the parameters up to the message part in order to get what we need.
The documentation is pretty detailed when it comes to GROK and a pattern debugger website with a GROK testing engine is available online, so you can develop and test your patterns before actually running them in Logstash.
So this is what I came up with for the SharePoint ULS logs:
|
1 2 3 4 5 6 7 8 9 10 11 12 13 14 15 |
filter { if [type] == "sharepointlog" { grok { match => [ "message", "(?<parsedtime>%{MONTHNUM}/%{MONTHDAY}/%{YEAR} %{HOUR}:%{MINUTE}:%{SECOND}) \t%{DATA:process} \(%{DATA:processcode}\)(\s*)\t%{DATA:tid}(\s*)\t(?<area>.*)(\s*)\t(?<category>.*)(\s*)\t%{WORD:eventID}(\s*)\t%{WORD:level}(\s*)\t%{DATA:eventmessage}\t%{UUID:CorrelationID}"] match => [ "message", "(?<parsedtime>%{MONTHNUM}/%{MONTHDAY}/%{YEAR} %{HOUR}:%{MINUTE}:%{SECOND}) \t%{DATA:process} \(%{DATA:processcode}\)(\s*)\t%{DATA:tid}(\s*)\t(?<area>.*)(\s*)\t(?<category>.*)(\s*)\t%{WORD:eventID}(\s*)\t%{WORD:level}(\s*)\t%{DATA:eventmessage}"] match => [ "message", “(?<parsedtime>%{MONTHNUM}/%{MONTHDAY}/%{YEAR} %{HOUR}:%{MINUTE}:%{SECOND})%{GREEDYDATA}\t%{DATA:process} \(%{DATA:processcode}\)(\s*)\t%{DATA:tid}(\s*)\t(?<area>.*)(\s*)\t(?<category>.*)(\s*)\t%{WORD:eventID}(\s*)\t%{WORD:level}(\s*)\t%{DATA:eventmessage}"] } date { match => ["parsedtime","MM/dd/YYYY HH:mm:ss.SSS"] } } } |
Logstash in action
All that’s left to do is to get Logstash going and see what comes out. Run the following on the command line:
|
1 |
logstash.bat agent -f "sharepoint.conf" |
This runs logstash as an agent, so it will monitor the file or the folder you specify in the input section of the config for changes. If you are indexing a folder where files appear periodically, you don’t need to worry about restarting the process, it will continue on its own.
Kibana time
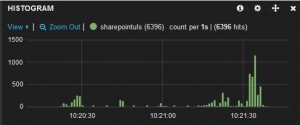
Now let’s create a new dashboard in Kibana and see what was indexed. The most straight-forward panel type is Histogram. Make no changes to the default settings of this panel (Chart value = count, Time field = @timestamp) and you should see something similar to this:
To get some more relevant information, we can add some pie charts and let them display other properties that we have mapped, for example ‘process’ or ‘area’.
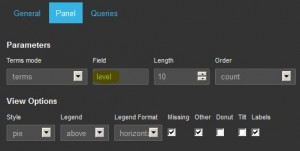
Now let’s turn this up a notch: through Kibana we can take a look at the errors in the SharePoint logs. Create a pie chart that displays the “level” field. By clicking on the “Unexpected” slice in this chart you will filter all the dashboard on this value.
Kibana will automatically refresh the page, the filter itself will be displayed in the “Filter” row and all you will see are the “Unexpected” events. Time to turn to the help of a Table chart: by displaying the columns you select on the Fields section of this chart, you can view and sort the log entries for a more detailed analysis of the unexpected events.
As the Logstash process runs as an agent, you can monitor the SharePoint events in real-time! So there you have it, SharePoint log analysis using ELK.


Thought I’d throw in here – I have a config that supports the multi-line expressions used for ULS logs pretty handily, just in case you’re still seeking log analysis bliss with Logstash:
  if [type] == "uls" {

    grok {

      match => { "message" => "%{DATESTAMP:ulstime}.? %{PROG:process} \(%{BASE16NUM:processid}\)%{SPACE}%{BASE16NUM:tid}%{SPACE}%{DATA:area}\s{2,}%{SPACE}%{DATA:category}\s{2,}%{SPACE}%{WORD:event_id}%{SPACE}%{WORD:priority}%{SPACE}%{DATA:ulsmessage}\.{,3}%{SPACE}(?[0-9a-f]{8}-[0-9a-f]{4}-[0-9a-f]{4}-[0-9a-f]{4}-[0-9a-f]{12})?$" }

      add_field => [ "received_at", "%{@timestamp}" ]

    }

    date {

      match => [ "ulstime", "MM/dd/YYYY HH:mm:ss.SS"]

      timezone => "America/Chicago"

    }

    mutate {

      replace => [ "message", "%{ulsmessage}" ]

      remove_field => [ "ulsmessage" ]

    }

    multiline {

      pattern => "^[^\.]"

      negate => true

      what => "previous"

      add_tag => [ "multiline" ]

    }

  }